A definitive guide to attracting transit ridership in the post-pandemic era.
Introduction
As the COVID-19 pandemic led to widespread city lockdowns and shelter-in-place mandates throughout 2020, many knowledge workers quickly found themselves needing to adopt the practice of teleworking or telecommuting full-time. Subsequently, work trips made for commuting purposes were drastically reduced across the globe. This resulted in a massive decrease in travel by all modes, but ridership levels on public transit dropped most precipitously.
The disproportionate loss of transit ridership was partially due to the heightened fear of contracting COVID-19 in public, crowded spaces such as buses or trains. Over time, this fear has been proven to be unfounded as studies showed limited possibility of contagion spread in public transit vehicles and few instances of COVID-19 clusters originating from transit. (Joselow 2020) However, the fear of riding public transit has persisted and hence patronage on public transit has not recovered at the same pace as travel by other modes.
This sudden drop in ridership and the slow pace of recovery has major implications for transportation planners as well as the public transit agencies themselves. More people switching to use personal automobiles means more traffic congestion and all the negative externalities that come with it, including more delays in travel time, accidents, air pollution, and constraints on economic growth. (Tumlin 2012) Less ridership on transit means less farebox revenue that agencies need to maintain service operations, and even less funding that could be used to expand service to encourage broader use of this sustainable transportation option.
The more that a transit agency depends on farebox revenue for operations (i.e., the higher an agency’s farebox recovery ratio), the worse they are impacted by drops in ridership. BART, for example, has a 70% farebox recovery ratio compared to SFMTA’s 24%. (Schweitzer 2017) Since SFMTA depends more on other funding sources such as the San Francisco General Fund, they can generally weather fluctuations in ridership better than BART. However, the risk of fiscal insolvency can still be a major possibility due to other factors such as the instability of other funding sources or the presence of a significant system maintenance backlog.
In the United States, federal funding to help public transit agencies stay afloat through the COVID-19 pandemic has been provided via legislation such as the American Rescue Plan of 2021. However, this funding is limited, and most agencies do not anticipate it lasting much beyond 2022. Every agency makes their own decisions on how to use their share of the funding, and some are actively trying to find ways to extend the runway provided by the funding for as long as possible.
Unfortunately, transit ridership is not currently projected to return to pre-pandemic levels until 2023 or later, given the persistence of public fears about COVID-19 as well as the anticipated continuation of teleworking (at least part-time or in a flexible schedule). In the San Francisco Bay Area where nearly 50% of the workforce is remote-eligible (mostly due to the prevalence of workers in the technology sector), this is particularly concerning to the transit agencies in the region that heavily depended on regular commuters to subsidize service for all other riders. (University of Chicago 2020)

Thus, assuming that a large segment of riders may not be returning anytime soon, transit agencies in the Bay Area are keen to find new ways of attracting ridership. This could include enticing former riders to come back and use the system in new ways, developing new rider bases by fostering mode shifts, or perhaps just increasing the number of trips taken by the remaining riders of the system.
This paper will dive into the existing academic literature about how to grow public transit ridership, investigate how several transit agencies (outside of the San Francisco Bay Area) are attempting to bring back riders in the post-pandemic era, identify common themes, and then synthesize some best practices and policy recommendations as advice for agencies going forward.
Literature Review
Fortunately, there has been copious amounts of research conducted regarding the factors underlying ridership trends in public transit. Brief summaries of the most cited journal articles are collected here.
Many general case studies highlighted basic service characteristics that have long been believed to influence ridership by agencies. (Mucci 2017) found bus ridership to be sensitive to changes in transit performance and supply (reliability and frequency) while rail ridership was most sensitive to demand drivers such as housing density. (Boisjoly, et al. 2018) demonstrated that vehicle revenue kilometers and car ownership were the main determinants of transit ridership across 25 transit agencies in Canada and the United States. Higher average fares were also found to be significantly associated with a decrease in ridership. (Kain and Liu 1999) studied the transit systems of Houston and San Diego, concluding that large service increases and fare reductions along with metropolitan employment and population growth were the principal reasons behind increases in transit use. Investments in bus systems were deemed more cost-effective than light rail systems. (Thompson and Brown 2006) conducted a multivariate analysis on transit ridership in U.S. metropolitan statistical areas (MSAs) between 1990 and 2000. They concluded that service coverage and frequency were the most powerful explanatory variables for variation in ridership change among MSAs between 1-5 million people, while a multi-destination service orientation was the most important variable for MSAs between 500K-1M people.
(Sharaby and Shiftan 2012) evaluated the impact of fare integration reform in a case study of Haifa in Israel. They found that a new fare policy that included a simplified five-zone fare system with free transfers resulted in an increase in passenger trips and boarding.
(Liu, et al. 2016) used a direct ridership model (DRM) to evaluate how station environments and transit service features could estimate ridership. For light rail stations, employment within a half-mile buffer area, service level, feeder bus connectivity, stations located in the CBD, and terminal stations were significant factors affecting ridership. For commuter rail, only feeder bus connections were found to be significant.
(Merlin, Singer and Levine 2021) examined transit accessibility as a factor that influences ridership and as a goal metric on its own, noting that transit service provision was the strongest influence on both job accessibility and ridership per capita. Population density also directly resulted in higher transit accessibility. Fixed-guideway transit had a more substantial effect on accessibility while non-fixed guideway transit had a larger effect on ridership per vehicle mile.
(Hess, et al. 2002) surveyed general managers of systems that added riders during the late 1990s. Service improvements, advertising/information campaigns, and universal fare coverage programs were perceived to have positively influenced ridership. Population growth, economic/employment growth, and worsening traffic congestion were also factors that led to increased transit patronage, but these factors were out of the control of transit managers and planners. Going further, (Taylor and Fink 2003) categorized a set of internal and external factors that affect transit ridership. Internal factors included pricing (fares), service quantity (revenue vehicle hours and miles of service), and service quality (customer service, safety, cleanliness, information, etc.). External factors included variables related to automobile access and utility (automobile ownership and parking availability), economic factors (unemployment levels, income levels, etc.), and spatial factors (population and employment density, traffic congestion levels, etc.).

Other studies also found external factors to be quite significant in determining levels of transit ridership. (Manville, Taylor and Blumenberg 2018) investigated the factors behind falling transit usage in Southern California. Increased motor vehicle access/ownership, particularly among low-income households, was found to be the most significant factor. (Ederer, et al. 2019) compared the performance of transit agencies over time using characteristics correlated with transit ridership, including total population, density, percentage of zero vehicle households, and transit agency operating expenditures. Change in population and service levels partially explained change in ridership for modes with dedicated right of way, but not mixed right of way modes.
A few studies looked more closely at route frequencies specifically. (Lyons, Ewing and Tian 2017) looked at whether temporal frequency or spatial route coverage was more impactful on ridership across 157 regions around the United States. Both factors were found to be strong predictors of ridership, with service frequency having a slightly greater impact (with 20% higher elasticity). (Berrebi, Joshi and Watkins 2021) evaluated ridership elasticity to frequency for 4 agencies between 2012 and 2018. While frequent routes were found to serve more passengers per trip than lower-frequency routes (possibly because of high concentration of demand), each marginal trip added to a route would generate diminishing productivity – that is, ridership is actually inelastic to frequency within route-segments.
Another set of studies looked at potential competitors to public transit such as bikesharing and transportation network companies (TNCs), all recognizing that the former was at least a more sustainable mode choice than the latter. (Campbell and Brakewood 2017) found evidence that the introduction of bikesharing led to reduced bus ridership in New York City. Specifically, their models suggested that every thousand bikesharing docks along a bus route was associated with a 1.69-2.42% reduction in daily unlinked bus trips on that route. (Martin and Shaheen 2014) evaluated survey data of annual bikesharing members across four cities to determine characteristics of those who shifted toward and away from public transit. Those who shifted toward public transit had attributes of increased age, being male, living in lower density areas, and having longer commute distances. (Graehler, Jr., Mucci and Erhardt 2018) also found that the introduction of bike share was associated with decreased bus ridership but increased light and heavy rail ridership.

As for TNCs, heavy rail ridership decreased by 1.3% and bus ridership decreased by 1.7% for every year after they entered the market, and this effect grew with time as TNC usage increased. (Erhardt, et al. 2021) similarly found that TNCs in San Francisco were responsible for net bus ridership decreases of 8.6-10.8%, negating about 7% of ridership gains from transit service increases. However, the same effect was not found significant for light rail ridership. In fact, (Mucci 2017) found that TNCs contributed 7% growth to light rail ridership along with a 10% decline in bus ridership. Finally, (Hall, Palsson and Price 2018) suggested that Uber reduced transit ridership in larger Metropolitan Statistical Areas (MSAs) but increased ridership in smaller ones via a complementary effect.
A few studies looked specifically at income as a possibly influential factor. (Lee, Tyner and Vasavda 2018) surveyed Muni customers in San Francisco and found that income coupled with the relative availability of ride-hailing services was a primary mode-choice driver. That is, as income rose, the propensity to take public transit decreased. However, they found better real-time transit information such as alternative routes and transfer connections could increase ridership overall. (Miller and Savage 2017) found mixed results when analyzing whether the ridership response to fare increases varied with per capita income in several Chicago neighborhoods.
Some studies investigated factors that were more environmental or psychological in nature. For example, (Zhou, et al. 2017) looked at the effect of intra-day variations in weather on travel behavior in Shenzhen, China. Increases in humidity, wind, and rainfall were associated with transit ridership decreases, with these effects only significant during off-peak hours. Ridership at metro stations in urban areas was more vulnerable to outdoor weather fluctuations. (Mendoza, et al. 2020) investigated the influence of media messages on transit ridership, specifically related to meteorology and air quality conditions. Ridership was found to be associated with favorable weather conditions and the effect was compounded by air quality conditions. (Brown, et al. 2016) concluded that factors such as proximity to new transit stops, housing density, and diverse walkable destinations near home were associated with ridership. Place attachment and pro-city attitudes were also found to be positive psychological variables.

Real-time information and better education overall were also found to be effective in a few studies. (Tang and Thakuriah 2012) found that a new real-time bus information system in Chicago had a modest positive effect on bus ridership, with larger effects on routes that received the technology at a later stage of the entire deployment period (following a theory of diffusion). Though other control variables were also found to have significant effects on bus ridership, such as fares, service attributes, gas prices, unemployment levels, and weather conditions. (Babka, Cooper and Ragland 2010) found that transit travel training for senior citizens was an effective way to increase familiarity with public transit and could increase ridership in the future.
Finally, a few studies looked specifically at the effects of the COVID-19 pandemic on transit ridership. (Hu and Chen 2021) found that the pandemic led to an average 72.4% drop in ridership, with more declines in commercial areas with higher percentages of white, educated, and high-income individuals. (Ahangari, Chavis and Jeihani 2020) found that the pandemic resulted in significant decreases in transit ridership across 10 cities each around the size of Baltimore. The lowest levels of ridership were in April 2020. Regression analysis showed that unemployment rate, income, percentage of essential unemployment, and vehicle revenue hours were all additional factors that contributed to the reduction in ridership.
Findings from Transit Agencies
Since transit agencies suffered such massive losses in ridership during the COVID-19 pandemic, many of them have actively explored various ways to lure back riders throughout 2021. Reviewing some of their tactics and outcomes where available can add more data points to potentially validate findings from the academic literature.
Chicago
The northeastern Illinois Regional Transportation Authority (RTA) funds three agencies in the Chicago metropolitan area: the Chicago Transit Authority (CTA), the commuter rail system Metra, and the suburban bus and paratransit system Pace. All three suffered major losses in ridership throughout the pandemic but have been steadily recovering riders throughout the later months of 2021.
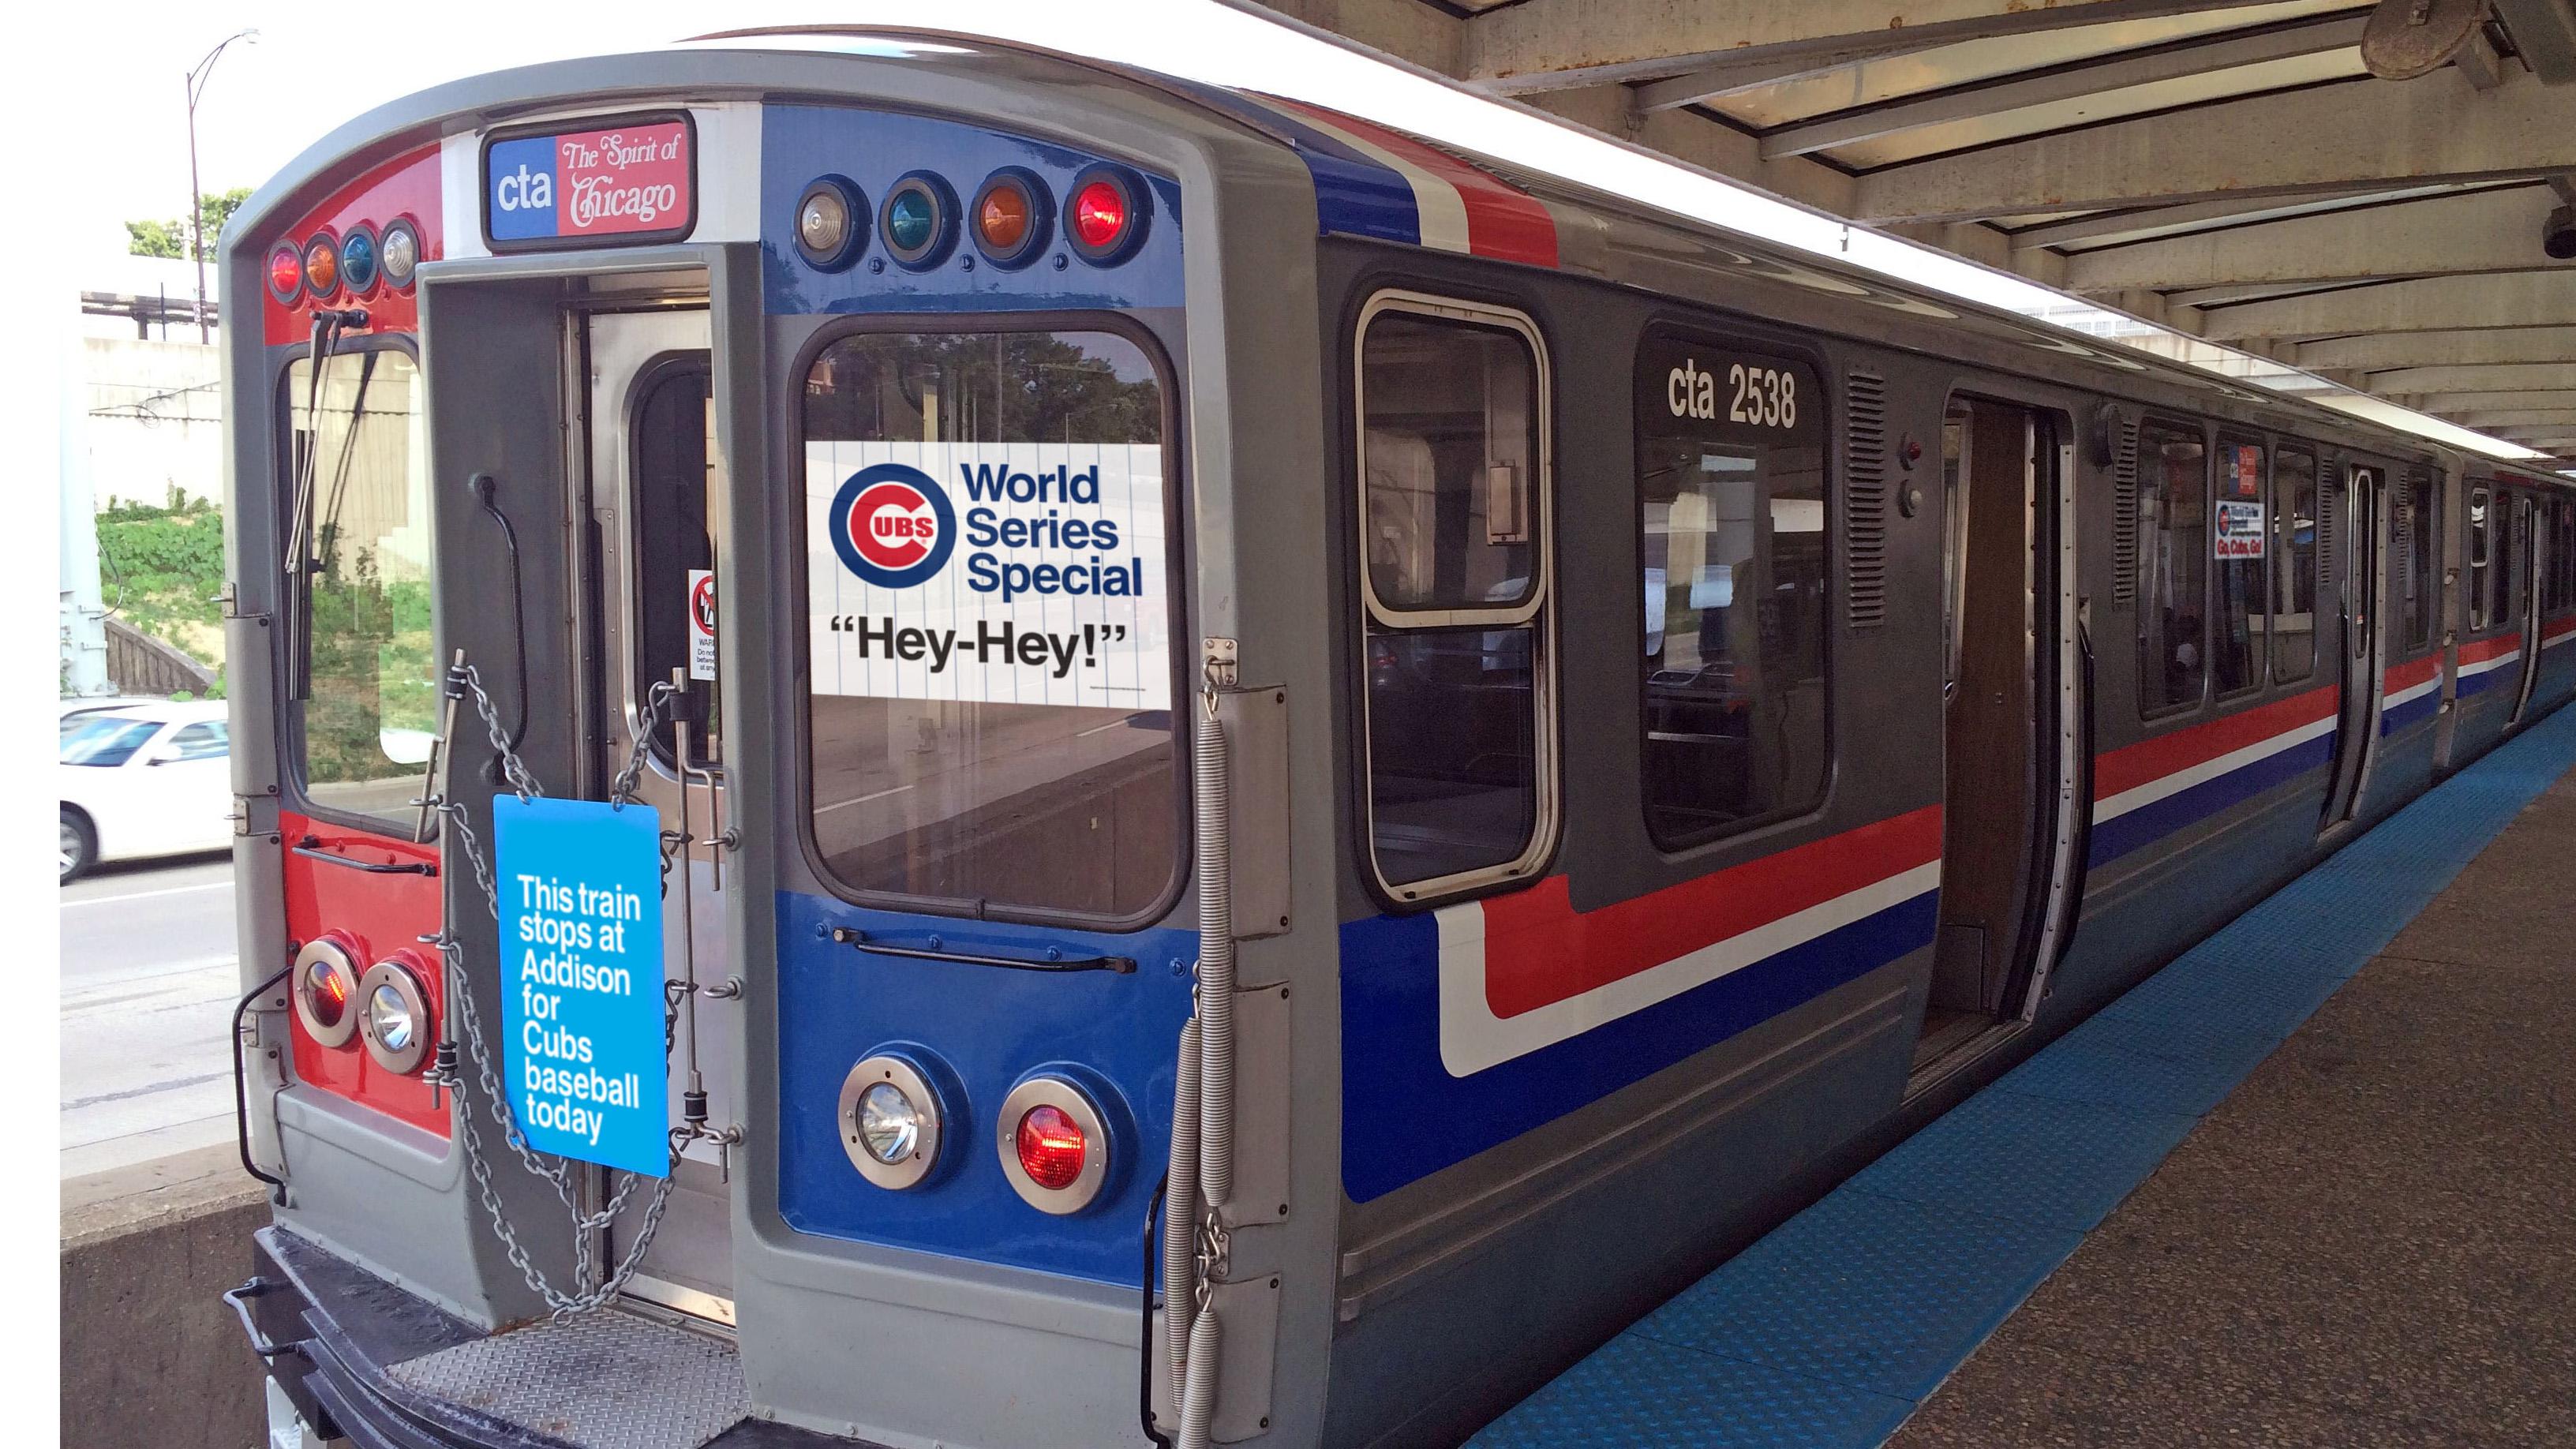
In May 2021 as part of the “Open Chicago” city-wide initiative, the CTA launched a “When You’re Ready, We’re Ready” advertising campaign and reduced the price of three of its unlimited-ride pass products: one-day, three-day, and seven-day passes. These promotional rates proved to be so popular, they were first extended through November 2021 and then made permanent. The agency reported that the passes generated more than 10 million rides over the summer months and those with passes took 56% more rides than those who were still using pay-as-you-go. (Chicago Transit Authority 2021) An online survey also revealed that 43% of respondents rode much more frequently with a pass and 20% of riders were choosing to return to transit due to the passes. (Greenfield, Deep discounts on CTA fare passes have helped fuel pandemic ridership recovery 2021) CTA decided to build upon this success and announced lower prices for 30-day passes in 2022 as well. Furthermore, they will be introducing a new policy of two free transfers between buses and trains within a two-hour period.
Metra introduced a $10 All-Day Pass in June 2020 and a Round Trip Plus Pass in September 2020. The number of riders using these passes increased continuously since their creation, with the share of riders using the Round Trip Plus Pass growing from 2.1% to 4.8% of overall ridership by June 2021. Total ridership on Metra had been increasing throughout the same time period, with a few drops coinciding with rises in COVID-19 cases and hospitalizations. As of October 2021, Metra decided to make the All-Day Pass permanent and replace the Round Trip Plus Pass with a new $6 Day Pass for up to three fare zones as a way to incentivize short trips and attract more customers. (Studenkov, Metra 2022 budget calls for new day pass, more wheelchair-accessible Chicago stations 2021) Metra is also planning to experiment with more frequent, all-day service instead of relying on peak-hour fares. A prior service increase to 20-minute headways at Hyde Park turned it into the most-used station outside of downtown. (Grabar, If Rush Hour Dies, Does Mass Transit Die With It? 2021)
Pace introduced an ad campaign in August 2021 featuring workers returning to offices and drawing attention to their sanitization efforts to keep their buses clean and safe. They also made targeted service changes for high school students and rush-hour commuters. Pace was already seeing ridership at about 55% of pre-pandemic levels and growing, and it is still unclear whether these new initiatives will boost this further. (Studenkov, Pace launches campaign to attract riders, restores some pre-pandemic service 2021)
Chicago’s experiments with fare structures and passes seem to support the research findings that pricing can have an impact on ridership, though no agency cut single-use base fares or proposed any kind of long-term “free” transit option. It’s also important to note that ridership may have increased regardless of any action on fares, as an RTA survey showed that 80% of respondents planned to return to pre-pandemic commuting habits once their worries were eased about COVID-19. In the same survey, respondents also cited service improvements (speed/reliability) and smoother transfers as higher priorities over fares. (Greenfield, RTA survey: Most people who stopped commuting by transit during COVID plan to return 2021) More transit-oriented development on Chicago’s South and West sides may also represent significantly larger long-term opportunities to build transit ridership. (R. Day 2021)
Seattle
The Seattle metropolitan area is served by King County Metro as the primary local bus operator, with regional express bus service and light rail coordinated by Sound Transit.

King County Metro received national recognition for its pilot of a fully-subsidized pass for low-income residents starting in late 2020. Despite launching right in the middle of the COVID-19 pandemic, over 6000 residents enrolled as of August 2021 and took double the number of rides compared to those who simply paid reduced fares. The boost in ridership was less noticeable for residents who did not have a bus stop in their neighborhood, reflecting the need to complement this strategy with more route coverage. (Results for America 2021)
Numerous marketing campaigns encouraging transit use were launched throughout 2020 and 2021, including a “Ready When You Are” public information campaign focusing on safety, “It’s a Great Day to Ride Metro” campaign featuring local scenic destinations, and a “Flip Your Trip West Seattle” campaign designed to inform residents about transportation alternatives during a bridge closure. The last campaign included incentives of $25 for pledging to replace car trips with transit. (Olsen 2021)
King County Metro has also been partnering with companies like Via to run pilots of new on-demand services in areas lacking frequent and reliable transit. These on-demand shuttles are designed to augment and not compete with transit, delivering riders to hubs such as light rail stations and incorporating free transfers. At least three of these pilots have launched since October 2020, but it’s too early to determine if these have been successful at driving more ridership. Service hours and service areas have been expanded over time, however, which is a promising sign for their popularity. (Rynning 2020)

Sound Transit began the pandemic by suspending fares on all transit modes and reducing service in multiple waves. Starting from June 2020, fare collection resumed but with special discounted “Recovery Fares” on light rail and a switch to a system-wide flat fare system on buses. (Sound Transit 2020) From then on, Sound Transit continued to restore service (especially focusing on frequency of light rail) as federal recovery funds were received, but recently had to reduce service again due to operator shortages.
To help riders feel more confident about riding transit, Sound Transit joined agencies from across the nation and signed on to APTA’s National Commitment for Safe Transportation in September 2020. It is unclear if this pledge had any discernable effect on ridership, but similar actions relating to pandemic safety also featured prominently in King County Metro’s recovery plan. (King County Metro 2020)

The most significant action from Sound Transit to boost ridership may be the opening of a brand-new major light rail extension with three stations in October 2021. Sound Transit also coordinated with King County Metro to ensure all the surrounding feeder bus services were updated at the same time. The new stations are projected to add 41,000-49,000 daily riders to the system by 2022. (Luczak 2021)
The agencies in Seattle demonstrate the potential for increased ridership through expanded service in both traditional and innovative ways. Targeted marketing campaigns and focused efforts to reduce fare burdens on vulnerable populations also seem to have some potential, but more rigorous study would be needed to validate these effects.
Others
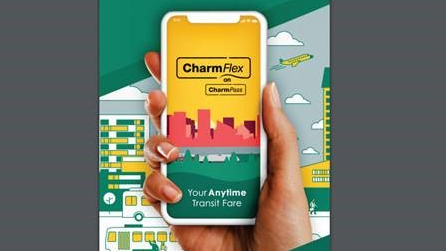
The Maryland Department of Transportation Maryland Transit Administration (MDOT MTA) introduced a new type of discounted fare option called “CharmFlex” in recognition of more flexible or hybrid work schedules starting from August 30, 2021. These three-day and 10-day passes can be used on consecutive or non-consecutive days and save riders about 15% compared to using a day pass or single-trip fare. (Mass Transit 2021) This new offering was launched at the same time MDOT MTA restored full levels of service, so it is not clear what proportion of ridership changes were a direct result of the new passes.
San Francisco Bay Ferry increased their service levels in July 2021, but targeted mid-day hours and weekends instead of the peak-hour weekday service that comprised most of their ridership before the pandemic. This move resulted in a surprise surge of riders, many of whom were trying the service for the first time. Saturdays and Sundays have now become the most popular days to ride the ferry. (Cano 2021) The pattern of weekend ridership recovering faster than weekday ridership is also a trend seen across various Bay Area transit agencies.
The Greater Richmond Transit Company (GRTC) instituted a fare-free policy in 2020 as part of pandemic-era safety measures, which seems to have helped them avoid sharp declines in ridership as a result. As of June 2021, ridership had recovered nearly to 2019 levels and officials were debating whether to continue the policy indefinitely (along with how to fund it). (Blumgart 2021) Notably, however, GRTC is a fairly small agency with limited coverage and a relatively small farebox recovery ratio.
Synthesis of Factors
Putting together the common drivers of ridership identified in both the academic literature and from transit agency reports, it becomes clear that they can be divided into two main categories: Factors that can be directly manipulated by transit agencies themselves (“internal”) and those that are larger-scale characteristics of the surrounding city or region that agencies have very little ability to influence on their own (“external”). Within these buckets, the factors can be subcategorized further.
Internal Factors
For example, transit agencies are generally in control of how they provision service, so long as they stay within their limited operational budgets. Increasing service frequencies, coverage, revenue vehicle kilometers/miles, or revenue vehicle hours (though not during peak hours in a post-pandemic context) all have been shown to increase ridership. Frequency is generally seen as more influential than coverage, with a caveat that there are diminishing returns when adding frequency to individual routes.
The quality of service also has an effect on ridership, with performance/speed/reliability mattering the most. Availability of customer service, a sense of safety both at stops and on-board vehicles, and cleanliness have also been identified as important factors.
Beyond service basics, the design/layout of the service network also seems to have an effect on ridership. Here, feeder services (including smooth transfers), a multi-destination service orientation, and well-located stations are identified as factors that have a positive impact.
Pricing of fares is a major subcategory, with higher fares shown to dampen ridership. Universal fare coverage programs (i.e., passes) designed for specific audiences (companies, institutions, low-income residents, etc.) are referenced often as a major driver of ridership, with mentions of free transfers and better integration/simplification or innovation on fare structures also supporting ridership in certain circumstances.
Finally, a collection of enhancements that keep riders well-informed seem to also support increased ridership. Real-time information (e.g., vehicle predictions or route alternatives), advertising campaigns, or comprehensive transit training programs for targeted groups (e.g., seniors) can have a positive impact.
All of these internal factors are summarized below.

External Factors
While transit agencies should certainly attempt to improve as many of the internal factors as they can, the research demonstrates that macro factors on a regional level can have far greater impact on transit ridership.
Conditions relating to automobile access (and the ability to utilize infrastructure designed for them) are some of the most commonly cited factors affecting transit ridership. Higher levels of car ownership, more parking availability, lower gas prices, and less traffic congestion have all been found to negatively impact ridership.
Spatial factors (i.e., density) have also been found to be major influences on transit ridership. These include housing density and population density, each a proxy for the other. Population growth, in general, leads to increased transit ridership as would be expected. The presence of walkable destinations (possible with sufficient density and/or transit-oriented development) has also been identified as a driver of ridership.
Economic factors also play a major role in ridership. Higher employment (especially a higher percentage of “essential” employment) leads to more ridership. Average incomes also matter, with higher incomes seemingly correlated with lower transit use.
Competing modes also figure prominently in the research. The introduction of TNCs or bike sharing has a conclusively net negative impact on transit ridership, with a potentially positive effect on light/heavy rail usage being outweighed by massive declines in bus ridership. However, one’s choice of whether to utilize a TNC versus transit also appears to depend on demographics and perceived costs of time, convenience, and comfort. (Hatfield 2020)
Several environmental factors seem to also play into ridership, with favorable weather and air quality contributing a positive effect. An airborne pandemic such as COVID-19 has a predictably negative impact on ridership. These factors are somewhat psychological in nature, making them more closely related to factors such as “place attachment” and “pro-city attitudes” in terms of categorization.
The full set of external factors is summarized below.

Conclusions / Recommendations
Given the relative prominence and proven efficacy of some factors over others, it is possible to conclude with some immediate (~1 year) recommendations for transit agencies as well as ideas for the longer term (5-10 years).
Short-term Recommended Tactics
If a transit agency such as SFMTA or BART wishes to take immediate action to promote ridership over the next year or so, it’s clear that the most effective strategies lie in pricing or service provision.
Innovate Around Fares
A third of Bay Area residents plan to commute to the office less after the COVID-19 pandemic, up to 47% for those making over $150,000 per year. (Li 2021) Given that the flexible working schedules of the future introduce inherent uncertainty about commuting patterns, agencies can no longer rely so heavily on fare structures and products designed for the traditional all-week 9-5 office worker. Monthly passes and even incentives for riding outside of peak periods are going to become less attractive going forward, so new offerings need to be created that acknowledge these trends.
Multi-day passes for non-consecutive days or passes for shorter trips between neighborhoods instead of assuming all rides go towards downtown cores are just a couple of novel concepts that can be piloted. Perhaps multi-modal passes that combine transit with bike share options can negate some of the ridership losses when bike sharing is introduced or otherwise reinforce the potential complementarity of these two transportation modes. Temporary discounts on all passes can drive initial customer acquisition which can then translate to more ridership over the lifetime of those passes, and this process can be repeated indefinitely.
Crafting passes specifically for targeted audiences (educational institutions, companies, low-income residents, etc.) is perhaps the most effective and proven way to boost ridership dramatically. This works best for populations with low rates of automobile ownership (such as students or seniors) but can also work for traditional office workers if there are also policies in place to limit the amount of free on-site parking available at their offices.
The potential benefits and downsides of fare-free transit are hotly debated across the United States at the moment. While free transit may provide a short-term boost in ridership, it has not yet been shown to be sustainable in two fundamental ways. First, it makes agencies financially insolvent – especially those with a high farebox recovery ratio. Secondly, it limits service expansion that would make transit more reliable and attractive, which ultimately limits how many people would choose to use it. A free transit system that goes nowhere is not helpful to anyone. (Grabar, The Problem With Free Transit 2021) Hence, if an agency wishes to consider eliminating fares entirely, they need to also have a plan for how to close the funding gap as well as ensure alternative revenue sources for future growth. Transit doesn’t need to be free, but it should be cost-competitive with other modes.
Expand Service Strategically and Responsibly

Academic research strongly suggests that adding more service (in terms of vehicle hours and distances) will boost ridership. Adding frequency to targeted lines with high ridership potential is generally favored over expanding raw coverage, but both can have a strong positive effect. However, there are diminishing returns when adding frequency to individual routes, so a more balanced approach across an entire system (e.g., adding enough frequency to several lines to meet a certain threshold or prevent crowding) is advised.
Of course, all of this must be considered in context with an agency’s available budget and other priorities. For example, if expanding service quantity comes at the expense of service quality (e.g., reliability), it may not be worthwhile.
Invest in Quality and Produce Targeted Marketing
In the wake of the COVID-19 pandemic, fear of public transit is still pervasive and numerous agencies have put resources into dispelling the myth that taking transit is an inherently dangerous activity. However, there is no clear evidence that the abundance of cleaning or marketing campaigns have had measurable impacts on ridership. In fact, any positive effects may be confounded by the continuous restoration of services and commuter activity happening at the same time.
That being said, it may be worth considering more targeted campaigns for certain audience segments, perhaps paired with some fare innovations as discussed above. Marketing new passes for students or training for seniors may be an effective strategy to boost ridership with these groups. In addition, if traffic congestion is worsening in a region, it may be worthwhile to promote the comparative reliability that a transit service with dedicated right-of-way can provide. Installation or improvement of existing real-time information systems at stations/stops can also reinforce riders’ sense of service quality.
Longer-term Planning
External factors seem to have a much larger impact on transit ridership than internal ones, so it is worthwhile for agencies to push on these where they can even if they cannot directly control them in the short-term.
For example, if an agency has any ability to influence the price of parking (as SFMTA does), making parking more expensive can potentially lead to significant mode shifts towards transit. A similar principle applies to traffic with the application of congestion pricing in targeted areas where ample transit alternatives exist. These policies may not be popular, but they are proven effective ways of ramping up ridership. (T. Day 2021) Essentially, making driving harder and the costs more salient while simultaneously making other forms of commuting easier will motivate more mode shifts. (Kristal and Whillans 2019)
Agencies that also own land around major transit stations (as BART does) have opportunities to influence the spatial factors that can contribute to ridership in the future. Transit-oriented development (TOD) is the classic example of this, focusing density within a short walkshed from a station to essentially guarantee ridership growth at that station. TOD can be carefully designed to create the walkable destinations and housing density needed to support new ridership indefinitely.

Transit agencies can also play a role in promoting economic growth that in turn will lead to more long-term ridership. Planning new service to future growth centers and enabling development along transit corridors will draw more residents and businesses to the area, potentially increasing ridership more effectively than any adjustment to an internal factor might.
Finally, it is essential for transit agencies to keep abreast of any potentially competitive modes and think creatively about how to work with them to ensure a more holistically sustainable transportation system overall. For example, on-demand services like TNCs have the potential to devastate bus ridership in urban areas but could also play a role as a feeder system supporting transit hubs in more suburban areas. Bike sharing may appear to siphon away transit riders but could also be positioned in locations that are more complementary than competitive.
Hence, while it may seem that transit ridership is more swayed by external factors that agencies cannot control, there are still clearly roles to play in ensuring more sustainable outcomes for all involved.
References
- Ahangari, Samira, Celeste Chavis, and Mansoureh Jeihani. Public Transit Ridership Analysis During the COVID-19 Pandemic. Preprint, medRxiv, 2020.
- Babka, Rhianna, Jill F. Cooper, and David R. Ragland. Removing Barriers for Seniors at Transit Stops and Stations and the Potential for Transit Ridership Growth. Research Report, Davis, CA: UC Davis: Institute of Transportation Studies, 2010.
- Berrebi, Simon J., Sanskruti Joshi, and Kari E. Watkins. “On bus ridership and frequency.” Transportation Research Part A: Policy and Practice 148 (June 2021): 140-154.
- Blumgart, Jake. How Did Richmond Rebuild Its Bus Ridership Numbers? August 5, 2021. https://www.governing.com/now/how-did-richmond-rebuild-its-bus-ridership-numbers (accessed November 26, 2021).
- Boisjoly, Geneviève, et al. “Invest in the ride: A 14 year longitudinal analysis of the determinants of public transport ridership in 25 North American cities.” Transportation Research Part A: Policy and Practice 116 (October 2018): 434-445.
- Brown, Barbara B., et al. “Environmental, behavioral, and psychological predictors of transit ridership: Evidence from a community intervention.” Journal of Environmental Psychology 46 (June 2016): 188-196.
- Campbell, Kayleigh B., and Candace Brakewood. “Sharing riders: How bikesharing impacts bus ridership in New York City.” Transportation Research Part A: Policy and Practice 100 (June 2017): 264-282.
- Cano, Ricardo. This Bay Area transit service is booming after adding more service on the weekends. September 13, 2021. https://www.sfchronicle.com/bayarea/article/This-Bay-Area-transit-service-is-booming-after-16453963.php (accessed November 26, 2021).
- Chicago Transit Authority. Proposed 2022 CTA Budget Maintains Essential Transit Service, Continues Pass Discounts That Have Supported a Return to Transit. May 27, 2021. https://www.transitchicago.com/proposed-2022-cta-budget-maintains-essential-transit-service-continues-pass-discounts-that-have-supported-a-return-to-transit/ (accessed November 26, 2021).
- Day, Richard. Allowing more density would help Chicago avoid a post-COVID transit death spiral. July 16, 2021. https://chi.streetsblog.org/2021/07/16/allowing-more-density-would-help-chicago-avoid-a-post-covid-transit-death-spiral/ (accessed November 26, 2021).
- Day, Thomas. Will Billions from Washington Bring Transit Riders Back? Not Necessarily. August 12, 2021. https://www.governing.com/community/will-billions-from-washington-bring-transit-riders-back-not-necessarily (accessed November 26, 2021).
- Ederer, David, Simon Berrebi, Diffee Chandler, Taylor Gibbs, and Kari E. Watkins. “Comparing Transit Agency Peer Groups using Cluster Analysis.” Transportation Research Record 2673, no. 11 (2019): 505-516.
- Erhardt, Gregory D., Richard Alexander Mucci, Drew Cooper, Bhargava Sana, Mei Chen, and Joe Castiglione. “Do transportation network companies increase or decrease transit ridership? Empirical evidence from San Francisco.” Transportation, February 2021.
- Grabar, Henry. If Rush Hour Dies, Does Mass Transit Die With It? February 11, 2021. https://slate.com/business/2021/02/mass-transit-subways-after-pandemic.html (accessed November 26, 2021).
- —. The Problem With Free Transit. June 01, 2021. https://slate.com/business/2021/06/free-transit-is-not-a-great-idea.html (accessed November 26, 2021).
- Graehler, Jr., Michael, Richard Alexander Mucci, and Gregory D. Erhardt. “Understanding the Recent Transit Ridership Decline in Major US Cities: Service Cuts or Emerging Modes?” 98th Annual Meeting of the Transportation Research Board. Transportation Research Board, 2018.
- Greenfield, John. Deep discounts on CTA fare passes have helped fuel pandemic ridership recovery. September 15, 2021. https://chi.streetsblog.org/2021/09/15/deep-discounts-on-cta-fare-passes-have-helped-fuel-pandemic-ridership-recovery/ (accessed November 26, 2021).
- —. RTA survey: Most people who stopped commuting by transit during COVID plan to return. April 15, 2021. https://chi.streetsblog.org/2021/04/15/rta-survey-most-people-who-stopped-commuting-by-transit-during-covod-plan-to-return/ (accessed November 26, 2021).
- Hall, Jonathan D., Craig Palsson, and Joseph Price. “Is Uber a substitute or complement for public transit?” Journal of Urban Economics 108 (November 2018): 36-50.
- Hatfield, Charles. Demographics Key to Transit versus Ride-Hail Choice. September 17, 2020. https://www.planning.org/blog/9205286/demographics-key-to-transit-versus-ride-hail-choice/ (accessed November 26, 2021).
- Hess, Daniel B., Allison Yoh, Hiroyuki Iseki, and Brian Taylor. “Increasing Transit Ridership: A Survey of Successful Transit Systems in the 1990s.” Journal of Public Transportation 5, no. 3 (2002): 33-66.
- Hu, Songhua, and Peng Chen. “Who left riding transit? Examining socioeconomic disparities in the impact of COVID-19 on ridership.” Transportation Research Part D: Transport and Environment 90 (January 2021): 102654.
- Joselow, Maxine. There Is Little Evidence That Mass Transit Poses a Risk of Coronavirus Outbreaks. July 28, 2020. https://www.scientificamerican.com/article/there-is-little-evidence-that-mass-transit-poses-a-risk-of-coronavirus-outbreaks/ (accessed November 26, 2021).
- Kain, John F, and Zvi Liu. “Secrets of success: assessing the large increases in transit ridership achieved by Houston and San Diego transit providers.” Transportation Research Part A: Policy and Practice 33, no. 7-8 (September-November 1999): 601-624.
- King County Metro. “COVID-19 Response and Recovery Report.” King County Metro. 2020. https://kingcounty.gov/~/media/depts/metro/schedules/ready-when-you-are/metro-recovery-plan.ashx (accessed November 26, 2021).
- Kristal, Ariella, and Ashley Whillans. Why It’s So Hard to Change People’s Commuting Behavior. December 24, 2019. https://hbr.org/2019/12/why-its-so-hard-to-change-peoples-commuting-behavior (accessed November 26, 2021).
- Lee, Jason, William Tyner, and Nealay Vasavda. “Moving Minds: The Next Generation of Real-Time Transit Information in San Francisco.” Transportation Research Record 2672, no. 8 (2018): 523-535.
- Li, Ronald. A third of Bay Area residents plan to commute less after pandemic, poll shows. April 13, 2021. https://www.sfchronicle.com/business/article/A-third-of-Bay-Area-residents-plan-to-commute-16098398.php (accessed November 26, 2021).
- Liu, Chao, Sevgi Erdogan, Ting Ma, and Frederick W. Ducca. “How to Increase Rail Ridership in Maryland: Direct Ridership Models for Policy Guidance.” Journal of Urban Planning and Development, December 2016.
- Luczak, Marybeth. Sound Transit Northgate Link LRT: ‘Welcome Aboard’. October 04, 2021. https://www.railwayage.com/passenger/light-rail/sound-transit-northgate-link-lrt-welcome-aboard/ (accessed November 26, 2021).
- Lyons, Torrey, Reid Ewing, and Guang Tian. Coverage vs Frequency : Is Spatial Coverage or Temporal Frequency More Impactful on Transit Ridership? Tech Report, Utah Department of Transportation, 2017.
- Manville, Michael, Brian D. Taylor, and Evelyn Blumenberg. Falling Transit Ridership: California and Southern California. Report, Los Angeles: UCLA: Institute of Transportation Studies, 2018.
- Martin, Elliot W., and Susan A. Shaheen. “Evaluating public transit modal shift dynamics in response to bikesharing: a tale of two U.S. cities.” Journal of Transport Geography 41 (December 2014): 315-324.
- Mass Transit. MDOT MTA launches CharmFlex fare options to match flexible commuter schedule. August 27, 2021. https://www.masstransitmag.com/technology/fare-collection/press-release/21236135/maryland-transit-administration-mta-mdot-mta-launches-charmflex-fare-options-to-match-flexible-commuter-schedule (accessed November 26, 2021).
- Mendoza, Daniel L., Martin P. Buchert, Tabitha M. Benney, and John C. Lin. “The Association of Media and Environmental Variables with Transit Ridership.” Vehicles 2, no. 3 (August 2020): 507-522.
- Merlin, Louis A., Matan Singer, and Jonathan Levine. “Influences on transit ridership and transit accessibility in US urban areas.” Transportation Research Part A: Policy and Practice 150 (August 2021): 63-73.
- Miller, Caroline, and Ian Savage. “Does the demand response to transit fare increases vary by income?” Transport Policy 55 (2017): 79-86.
- Mucci, Richard A. Transportation Network Companies: Influencers of Transit Ridership Trends. Master’s Thesis, University of Kentucky, 2017.
- Olsen, Katie. New! ‘Flip Your Trip West Seattle’ encourages use of transit, vanpool, shared bikes and scooters during the West Seattle Bridge closure. September 23, 2021. https://sdotblog.seattle.gov/2021/09/23/new-flip-your-trip-west-seattle-encourages-use-of-transit-vanpool-shared-bikes-and-scooters-during-the-west-seattle-bridge-closure/ (accessed November 26, 2021).
- Results for America. Subsidized annual transit fares: Ensuring transit affordability to low-income residents of King County, WA. May 12, 2021. https://catalog.results4america.org/program/individual-incentives-for-public-transportation/subsidized-transit-fares-king-county-wa (accessed November 26, 2021).
- Rynning, Torie. New on-demand ride service ramps up in Crossroads area. October 1, 2020. https://kingcountymetro.blog/2020/10/01/new-on-demand-ride-service-ramps-up-in-crossroads-area/ (accessed November 26, 2021).
- Schweitzer, Lisa. “Mass Transit.” In The Geography of Urban Transportation, by Genevieve Giuliano, & Susan Hanson, 187-217. New York: The Guilford Press, 2017.
- Sharaby, Nir, and Yoram Shiftan. “The impact of fare integration on travel behavior and transit ridership.” Transport Policy 21 (May 2012): 63-70.
- Sound Transit. Reduced fare options will accompany June 1 reintroduction of fares on Link and Sounder. May 18, 2020. https://www.soundtransit.org/get-to-know-us/news-events/news-releases/reduced-fare-options-will-accompany-june-1-reintroduction (accessed November 26, 2021).
- Studenkov, Igor. Metra 2022 budget calls for new day pass, more wheelchair-accessible Chicago stations. October 21, 2021. https://chi.streetsblog.org/2021/10/21/metra-2022-budget-calls-for-new-day-pass-more-wheelchair-accessible-chicago-stations/ (accessed November 26, 2021).
- —. Pace launches campaign to attract riders, restores some pre-pandemic service. August 3, 2021. https://chi.streetsblog.org/2021/08/03/pace-launches-campaign-to-attract-riders-restores-some-pre-pandemic-service/ (accessed November 26, 2021).
- Tang, Lei, and Piyushimita Vonu Thakuriah. “Ridership effects of real-time bus information system: A case study in the City of Chicago.” Transportation Research Part C: Emerging Technologies 22 (June 2012): 146-161.
- Taylor, Brian D., and Camille N.Y. Fink. The Factors Influencing Transit Ridership: A Review and Analysis of the Ridership Literature. Working Paper, Los Angeles, CA: UCLA Institute of Transportation Studies, 2003.
- Thompson, Gregory L., and Jeffrey R. Brown. “Explaining Variation in Transit Ridership in U.S. Metropolitan Areas between 1990 and 2000: Multivariate Analysis.” Transportation Research Record 1986, no. 1 (2006): 172-181.
- Tumlin, Jeffrey. Sustainable Transportation Planning. New York: John Wiley & Sons, Incorporated, 2012.
- University of Chicago. With much of U.S. staying at home, how many jobs can be done remotely? March 30, 2020. https://news.uchicago.edu/story/much-us-staying-home-how-many-jobs-can-be-done-remotely (accessed April 27, 2021).
- Zhou, Meng, Donggen Wang, Qingquan Li, Yang Yue, Wei Tu, and Rui Cao. “Impacts of weather on public transport ridership: Results from mining data from different sources.” Transportation Research Part C: Emerging Technologies 75 (February 2017): 17-29.

An additional resource from APTA that I did not have a chance to incorporate into this report, but contains some great recommendations for transit agencies as well: https://www.apta.com/research-technical-resources/research-reports/on-the-horizon-planning-for-post-pandemic-travel/
LikeLike
Another data point that passes work to boost ridership: https://mass.streetsblog.org/2021/12/08/free-passes-for-bostons-main-street-workers-boost-transit-bluebikes-ridership/
LikeLike
Some more evidence that on-demand services also have potential to help grow ridership: https://www.geekwire.com/2021/seattle-area-counties-experiment-with-on-demand-door-to-door-public-bus-service-is-showing-promise/
LikeLike
Another data point from Chicago: https://chi.streetsblog.org/2022/05/17/report-fair-transit-south-cook-pilot-led-to-faster-ridership-recovery/
LikeLike
LA Metro’s recent mobility-on-demand pilot with Via seemed to go well: https://www.enotrans.org/article/evaluating-point-to-point-mobility-on-demand-lessons-from-los-angeles/
Seems to have transitioned into their Metro Micro program: https://micro.metro.net/
LikeLike
Another fascinating case study of free transit in Luxembourg not leading to a noticeable reduction in car usage:
https://www.bloomberg.com/news/articles/2022-07-07/inside-luxembourg-s-experiment-with-free-public-transit
LikeLike
New research on the concept of free transit: https://transweb.sjsu.edu/research/2236-Public-Transit-Equity-Congestion-Pricing
LikeLike
More data showing that the recovery of transit ridership across the United States will be slow going: https://www.enotrans.org/article/transit-ridership-not-expected-to-return-to-pre-pandemic-levels-this-decade/
LikeLike